The gross GST revenue collected in the month of November, 2020 is ₹ 1,04,963 crore of which CGST is ₹ 19,189 crore, SGST is ₹ 25,540 crore, IGST is ₹ 51,992 crore (including
₹ 22,078 crore collected on import of goods) and Cess is ₹ 8,242crore (including ₹ 809 crore collected on import of goods). The total number of GSTR-3B Returns filed for the month of November up to 30th November 2020 is 82 lakhs.
The government has settled ₹ 22,293 crore to CGST and ₹ 16,286 crore to SGST from IGST as regular settlement. The total revenue earned by Central Government and the State Governments after regular settlement in the month of November 2020 is ₹ 41,482 crore for CGST and ₹ 41,826 crore for the SGST.
In line with the recent trend of recovery in the GST revenues, the revenues for the month of November 2020 are 1.4% higher than the GST revenues in the same month last year. During the month, revenues from import of goods was 4.9% higher and the revenues from domestic transaction (including import of services) are 0.5% higher that the revenues from these sources during the same month last year.
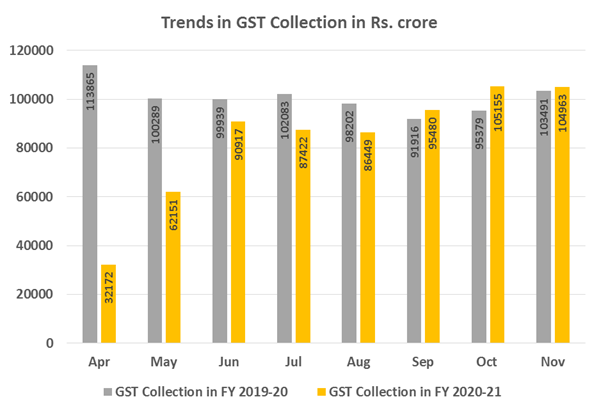
The chart below shows trends in monthly gross GST revenues during the current year. The table shows the state-wise figures of GST collected in each State during the month of November 2020 as compared to November 2019.
State-wise growth of GST Revenues during Nov 2020[1]
| State | Nov-19 | Nov-20 | Growth |
| Jammu and Kashmir | 363 | 360 | -1% |
| Himachal Pradesh | 701 | 758 | 8% |
| Punjab | 1,375 | 1,396 | 2% |
| Chandigarh | 165 | 141 | -14% |
| Uttarakhand | 1,280 | 1,286 | 0% |
| Haryana | 5,904 | 5,928 | 0% |
| Delhi | 3,995 | 3,413 | -15% |
| Rajasthan | 3,071 | 3,130 | 2% |
| Uttar Pradesh | 5,678 | 5,528 | -3% |
| Bihar | 1,107 | 970 | -12% |
| Sikkim | 157 | 223 | 42% |
| Arunachal Pradesh | 36 | 60 | 68% |
| Nagaland | 23 | 30 | 31% |
| Manipur | 35 | 32 | -9% |
| Mizoram | 17 | 17 | 0% |
| Tripura | 51 | 58 | 13% |
| Meghalaya | 117 | 120 | 2% |
| Assam | 958 | 946 | -1% |
| West Bengal | 3,460 | 3,747 | 8% |
| Jharkhand | 1,720 | 1,907 | 11% |
| Odisha | 2,347 | 2,528 | 8% |
| Chhattisgarh | 2,176 | 2,181 | 0% |
| Madhya Pradesh | 2,453 | 2,493 | 2% |
| Gujarat | 6,805 | 7,566 | 11% |
| Daman and Diu | 101 | 2 | -98% |
| Dadra and Nagar Haveli | 145 | 296 | 105% |
| Maharashtra | 15,968 | 15,001 | -6% |
| Karnataka | 6,972 | 6,915 | -1% |
| Goa | 342 | 300 | -12% |
| Lakshadweep | 2 | 0 | -75% |
| Kerala | 1,691 | 1,568 | -7% |
| Tamil Nadu | 6,449 | 7,084 | 10% |
| Puducherry | 157 | 158 | 1% |
| Andaman and Nicobar Islands | 25 | 23 | -7% |
| Telangana | 3,349 | 3,175 | -5% |
| Andhra Pradesh | 2,230 | 2,507 | 12% |
| Ladakh | – | 9 | |
| Other Territory | 153 | 79 | -48% |
| Centre Jurisdiction | 95 | 138 | 45% |
| Grand Total | 81,674 | 82,075 | 0.5% |
Team Chartered Online. Reach us at admin@charteredonline.in